
A shared Python pipeline for crypto and stock data
Financial data is rarely available in exactly the structure your analytical application needs.
Cryptocurrency markets trade continuously, while stock exchanges follow trading sessions, weekends and holidays.
The main source of crypto data, Binance, distributes historical archives alongside a live REST API. Yahoo Finance exposes stock and index observations through a different interface, with different metadata, availability limits and missing fields.
Nevertheless, once the data reaches an analytical application, the requirements for both kinds of assets are remarkably similar: clean timestamps, consistent OHLCV columns, predictable data types and explicit handling of incomplete or unavailable observations.
That observation led to two connected package releases: an update to hdw_crypto_data, now at version 0.2.0 and the first release of hdw_stock_data, version 0.1.0.
The two packages are independent. Each handles the realities of its own provider, but both produce compatible, analysis-ready pandas DataFrames. This allows the same downstream charting and technical-analysis application to work with either crypto or stock-market data.
This is not intended to make Binance and Yahoo behave as if they were the same source. The objective is to give downstream applications a stable interface despite their differences.
Why build a second package for stock data?
The project began with HdWCryptoData, an installable package that combines historical Binance Vision archives with recent Binance REST API candles.
Its purpose is to turn fragmented cryptocurrency observations into standardized pandas DataFrames suitable for applications such as:
- Technical analysis;
- Machine learning;
- Event studies;
- Strategy research;
- Data visualization;
- Reproducible market experiments.
Building the crypto package demonstrated that acquisition, validation, normalization and analysis are separate concerns and should therefore remain separate responsibilities in the source code. The package takes responsibility for producing a dependable dataset, while analytical applications should focus on what to do with it.
The next question was whether that separation would survive contact with a substantially different market-data source. Stock research required comparable OHLCV data, but simply adapting the Binance code would have been the wrong approach.
Stock markets introduce different trading calendars, session gaps, ticker conventions and provider limitations. Some fields available for Binance candles—such as the number of trades—are not available from Yahoo.
This led to a separate package rather than a growing collection of provider-specific conditions inside the crypto project. hdw_stock_data therefore handles Yahoo retrieval and stock-specific validation independently, while conforming to a shared downstream data contract.
Two different acquisition pipelines
The two packages solve two different acquisition problems outlined below.
Cryptocurrency data
hdw_crypto_data combines:
- Historical kline archives from Binance Vision;
- Recent candles retrieved through the Binance REST API;
- Verification and normalization logic;
- A total-dataset builder and loader.
This reflects the continuously traded nature of cryptocurrency markets and Binance’s separation between archived and recent observations. The package can verify downloaded archives using Binance checksum files, distinguish missing archives from operational failures and combine historical and recent observations into one dataset.
Stock and index data
hdw_stock_data retrieves observations directly from Yahoo’s chart HTTP endpoint using requests. It does not use the yfinance library, as an earlier script did.
This initial release deliberately has a narrow, tested scope:
- Hourly (1h) observations;
- Requests of up to 730 days;
- Stocks and indices supported by the Yahoo endpoint;
- Timezone-aware normalized output;
- Optional atomic CSV snapshots.
The 730-day range is a tested capability limit, not a promise that every symbol will have observations for the complete period. Newly listed securities and instruments with limited history may naturally return less data.
These differences remain explicit at the acquisition layer rather than being concealed behind artificial equivalences. Standardization begins only where a common representation is useful.
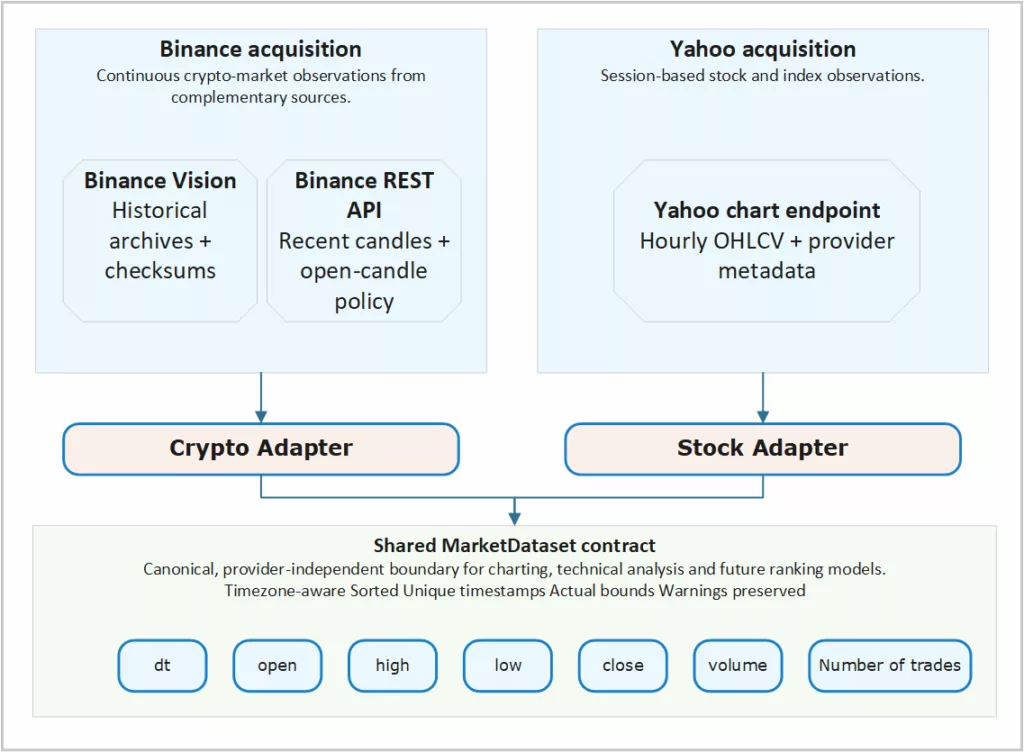
Figure 1. Provider-specific acquisition paths converging at the shared MarketDataset contract.
The packages share a compatible DataFrame structure, while the showcase’s independent stock and crypto adapters translate their provider-specific results into the common MarketDataset application contract.
The shared DataFrame contract
The central integration point is a shared DataFrame structure. Both pipelines produce compatible pandas DataFrames with a sorted, unique and timezone-aware DatetimeIndex named dt. Canonical DataFrame structure contains the compatible timestamp, OHLCV and optional trade-count representation produced by the packages. Their values use predictable numeric types suitable for downstream calculations. Neither pipeline implicitly shifts timestamps or resamples observations.
This contract gives the analytical layer a stable answer to the simple question hat minimum structure must a market dataset provide before charting or analysis can begin?
For Binance data, number_of_trades can contain actual values. Yahoo does not provide equivalent trade-count observations through this interface, so hdw_stock_data represents them as missing values using pandas’ nullable data types. That distinction matters: an unavailable value is not the same as zero trades.
Provider-specific information—such as the provider’s name, exchange, currency, requested range, actual normalized range and warnings—is kept outside the core DataFrame in structured metadata. This prevents analytical columns from becoming mixed with descriptive information while still preserving context. The result is interoperability without erasing provenance.
What changed in hdw_crypto_data 0.2.0
Version 0.2.0 makes generated datasets easier to identify and the treatment of unfinished candles more explicit.
Self-describing total-dataset filenames
Generated total CSV files now include the market, asset class, interval and actual UTC time range. For example:
BTCUSDT-spot-1h-total-2026-08-01T00-00-00Z–2026-09-21T23-00-00Z.csv.
A filename now communicates substantially more than a generic name such as:
BTCUSDT-total.csv.
This is especially useful when multiple experiments, time ranges or assets are stored together. The dataset’s coverage can be inspected before the file is opened. The loader can automatically discover matching range-named datasets while retaining a fallback for the earlier legacy filename.
An explicit open-candle policy
The most recent candle returned by a live endpoint may still be forming. Its close, high, low, volume and trade count can change until the interval ends. Version 0.2.0 makes handling that candle an explicit policy:
- exclude, omits an unfinished candle, while:
- include, retains it for live dashboards or exploratory inspection.
The default is to exclude the open candle. This is the safer choice for reproducible technical analysis, model training and historical evaluation.
Making the decision explicit is more important than choosing one universal answer. A live dashboard and a backtest have different requirements; the package should force that distinction into the open.
Stronger operational transparency
The package also distinguishes between:
- archives that legitimately do not exist,
- network failures;
- rate limits;
- checksum failures;
- invalid archives;
- incomplete historical coverage.
These controls improve data integrity and make failures easier to diagnose. They should not be described as investment safeguards: their purpose is to reduce silent technical errors in the data pipeline.
What hdw_stock_data 0.1.0 adds
The new stock package retrieves hourly stock and index observations directly from Yahoo and turns them into a validated market-data result.
A minimal example is:
from hdw_stock_data import YahooStockLoader

result = YahooStockLoader().load(
    "^GSPC",
    interval="1h",
    days=730,
    preferred_tz="Europe/Amsterdam",
    save_to="snapshots",
)

sp500 = result.dataframe
print(result.descriptor)
print(result.filepath)
print(result.warnings)Listing 1. Import & use the package
The result contains the normalized DataFrame plus useful contextual information, including:
- Provider;
- Symbol;
- Currency and exchange, when supplied by Yahoo;
- Actual start and end timestamps;
- Observation count;
- Output timezone;
- Warnings;
- The optional snapshot path.
The package validates the returned observations rather than assuming every provider response is analytically safe. Among other checks, it rejects invalid timestamps, non-finite values, negative volume and impossible OHLC relationships.
Missing OHLC rows are removed. Missing volume can remain missing. When duplicate timestamps occur, the last valid observation is retained.
This is important for stock data because an absent hourly observation can have several explanations: a closed exchange, a trading halt, an instrument-specific issue or missing provider data. Automatically fabricating a continuous timeline would destroy that distinction.
Atomic, range-named snapshots
When requested, hdw_stock_data writes an atomic CSV snapshot with a filename based on the actual normalized time range. An atomic write reduces the risk of leaving a partially written file if output fails midway. The resulting snapshot is also easier to identify and reuse later without repeating the provider request.
The package does not require CSV as an intermediate step. Callers can use the returned DataFrame directly or choose to persist a snapshot.
Easy to install, inspect and reuse
Publishing the projects on PyPI lowers the practical threshold for using them. There is no longer a need to copy individual Python files from an older article, repair imports or reproduce a particular development-directory layout.
Install the stock package with: python -m pip install hdw-stock-data
Then import it in a script, notebook or application:
from hdw_stock_data import YahooStockLoader
The project is available through:
The crypto package is available through:
PyPI provides versioned, installable distributions. GitHub provides source code, documentation, examples, tests, development history and issue reporting. Together, they provide two things that standalone scripts cannot offer as cleanly: a stable installation route and an inspectable public development history.
Both packages currently have alpha development status. Their interfaces are usable, but users should still expect the possibility of changes as broader provider and interval support is added.
The re-engineered showcase
Both repositories now include an upgraded example application demonstrating how the common contract can support multiple market-data providers.
The PyQt6 showcase offers separate adapters for:
- Yahoo stock and index data;
- Binance cryptocurrency data;
- Canonical CSV imports;
- Existing compatible DataFrames.
The acquisition paths remain provider-specific, but every adapter returns the same type of market dataset to the visualization layer.
This produces a useful architectural separation:
Once a dataset reaches the charting layer, the application does not need to know whether the observations originated from Binance, Yahoo, a CSV file or an already existing DataFrame. That is the primary benefit of the shared interface. A new analytical chart or transformation can be written once and then applied to multiple asset classes.
The showcase currently supports source selection, multiple asset selection, stock and crypto symbol handling, display-timezone selection, batch acquisition, progress and error reporting, reuse of previously loaded datasets and also canonical CSV import, export of enhanced datasets and technical-analysis and Plotly visualizations.
The charting application is deliberately kept outside the lightweight core packages. Heavy optional dependencies such as PyQt6, Plotly, SciPy and technical-analysis libraries are therefore not imported merely to retrieve market data. The showcase demonstrates the interface; it is not itself part of the core data-acquisition responsibility.
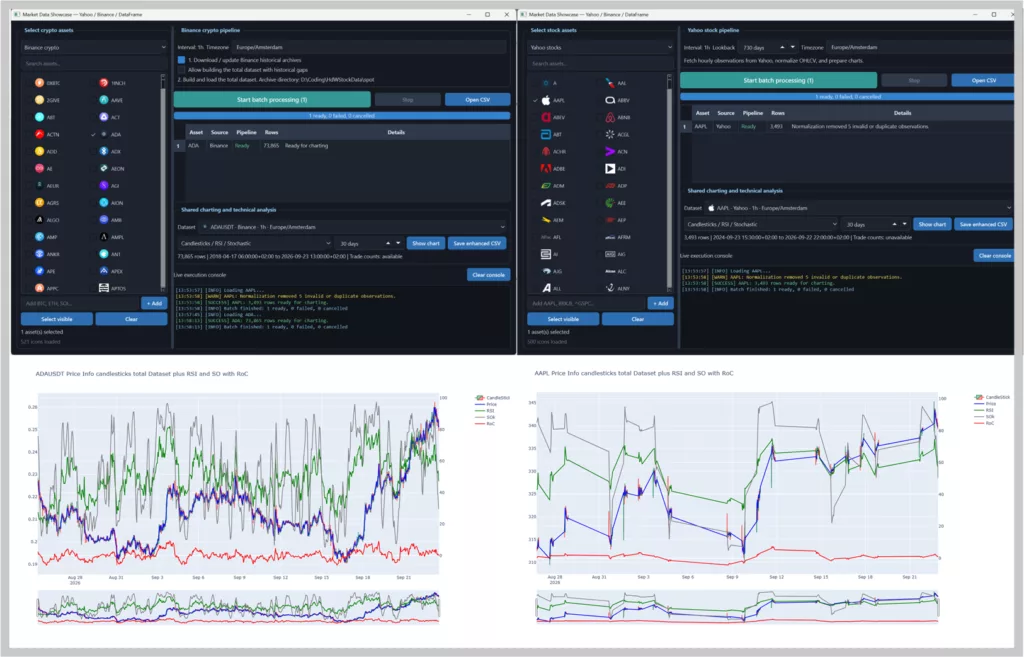
Figure 2. Crypto and stock datasets processed through the same showcase interface and charting pipeline: ADA on the left and AAPL on the right.
Standardization without pretending the markets are identical
A shared schema can create the temptation to hide every difference between providers. That would make the interface superficially convenient but analytically unreliable. This project follows a different principle: Standardize what is structurally equivalent, preserve what is materially different and represent what is unavailable as unavailable.
That means stock-session gaps are not automatically treated as missing hourly crypto candles. Missing Yahoo trade counts are not replaced with zero. Provider metadata is preserved outside the analytical frame. Open cryptocurrency candles are governed by an explicit policy. Timestamp offsets remain visible and timezone-aware. The original acquisition packages remain independent.
The common contract is therefore intentionally small. It standardizes the part that downstream tools genuinely share, rather than forcing all providers into an artificial universal model.
What comes next
The shared showcase also creates a controlled environment for exploring a more subtle question: what does a technical-analysis chart actually know at each moment in time?
A future article will use the application to compare, among other things causal Keltner Channel confirmations based only on current and past observations with retrospective Gaussian-smoothed peaks and troughs that use observations on both sides of a historical point. Also, we’ll discuss signal confirmation time versus realistic execution time and trend illustration versus live decision support.
The risk of presenting hindsight-based turning points as contemporaneous buy or sell signals, is also mentioned, because a visually convincing chart is not automatically a reproducible trading method.
Beyond visualization, the shared data contract also provides a foundation for a separate new project: hdw_asset_ranker. That project can concentrate on feature generation, comparison and asset ranking instead of duplicating provider retrieval and normalization logic.
The progression is becoming clear:

Figure 3. Conceptual evolution
hdw_stock_data 0.1.0 is therefore more than a second downloader. It tests whether a reusable analytical boundary can survive across fundamentally different financial-data sources. So far, the answer is yes—provided that standardization is applied carefully and the differences remain explicit.
Project links
hdw_stock_data 0.1.0
hdw_crypto_data 0.2.0
These packages and their showcase are research and software-development tools. They do not provide investment advice, and the presence of an indicator or chart marker should not be interpreted as a recommendation to trade.
Ask a Question or give Feedback about this article